Engage stakeholders, in ways you couldn’t do before.
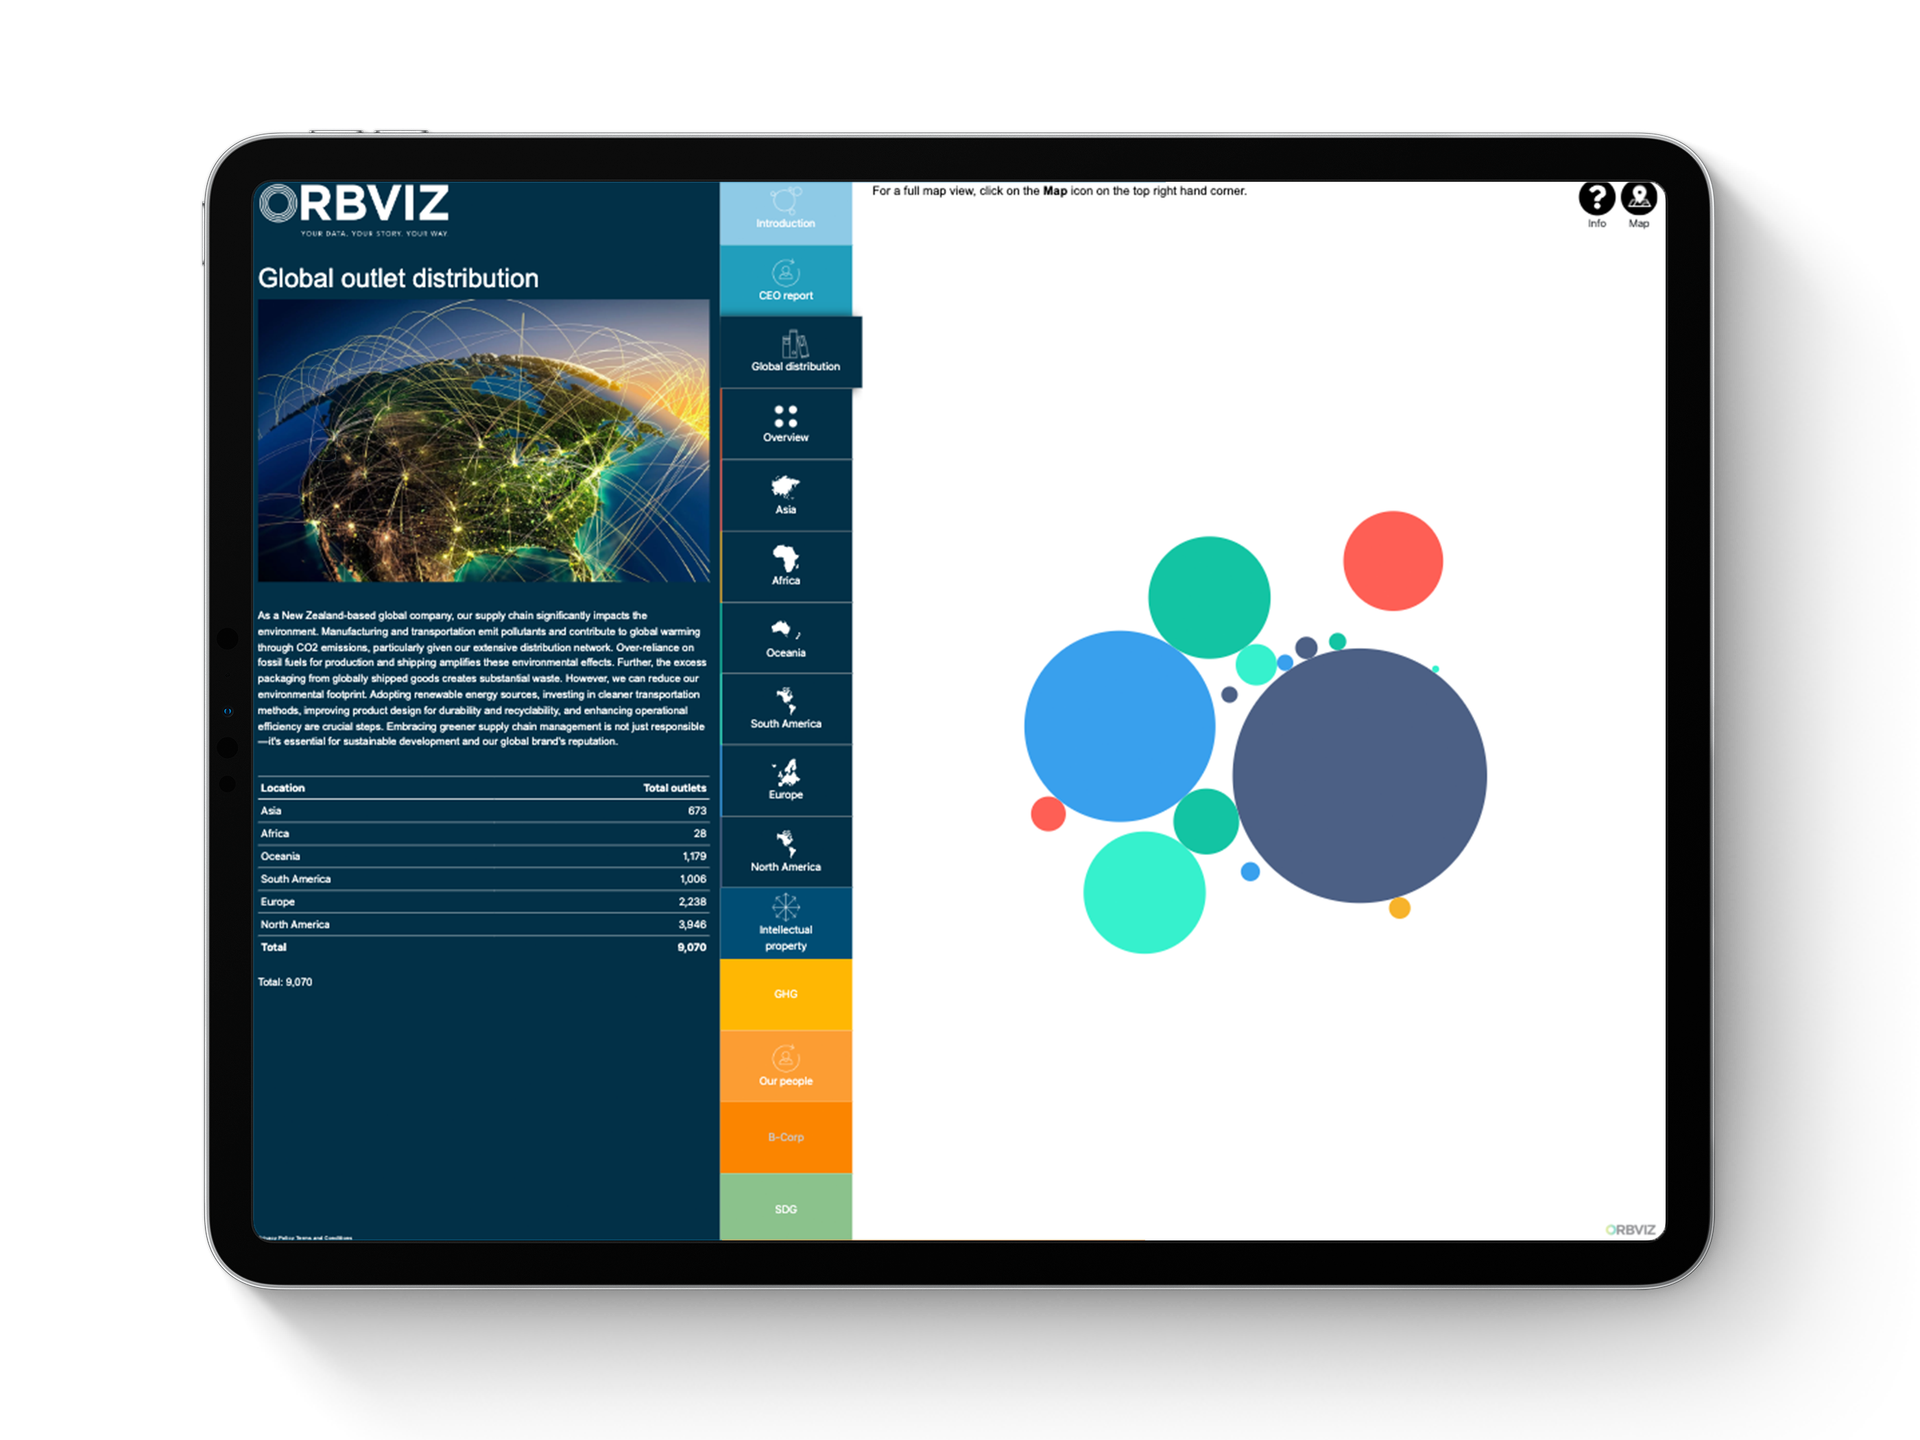
Transform your static reports and spreadsheets into interactive reports that stakeholders can easily access, explore, understand, and respond to.
From status quo to breaking boundaries
“I am a fan of simple, interactive portrayal of complex data – your presentation of the budget hits the mark in my view. ”
Public feedback

Create and update reports in minutes, not hours
1
Drag & drop your data2
Customise branding and add stories3
Share your report and get feedback4
Track engagement and measure impact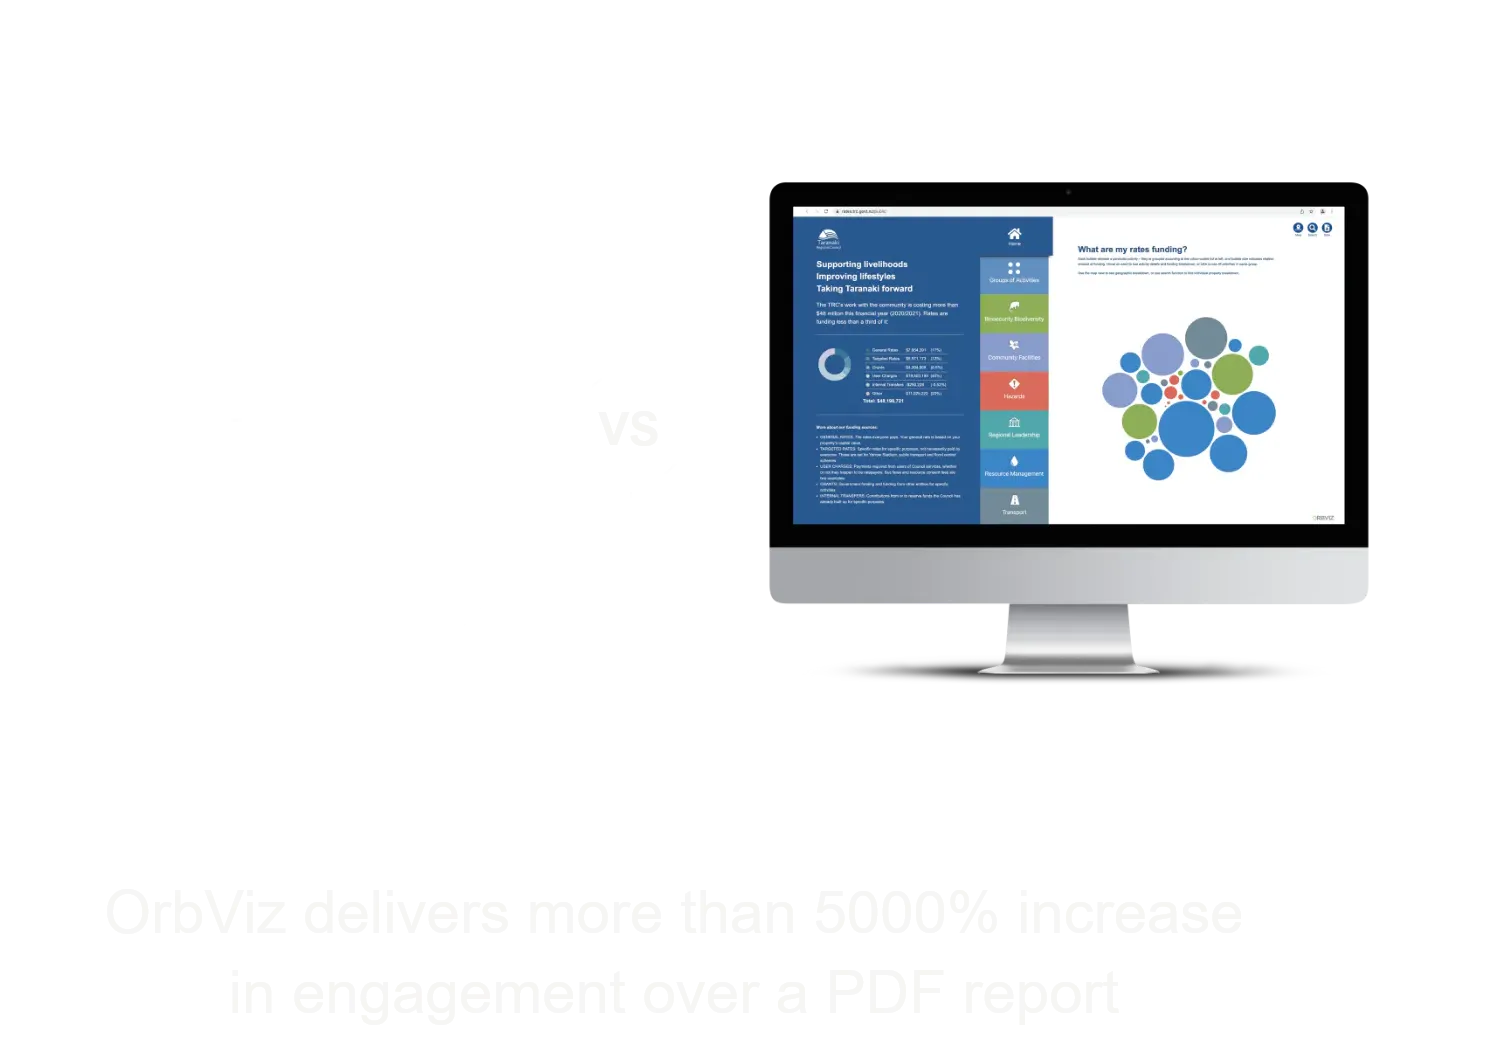
Discover How OrbViz Transforms Your Reporting
Use Case
Financial Reporting - From line items to instant insights
- Opex and Capex
- Annual reporting
- Comparative YoY trends
Use Case
ESG Reporting - Build trust through transparency
- Track YoY emissions
- Goal setting and progress
- Transparency and trust
Use Case
Thinking outside the Bubble - From siloed information to a single source of truth
- Create two-way conversations
- Accessible data for all stakeholders
- Forward-thinking, innovative, engaging reports